📚 Web5 Trading Academy — Professional Education

Master the Markets.
Trade with Precision.

Four professional modules developed by the Web5 trading division. Built for traders who want to understand why markets move — not just follow signals blindly.

MODULE 01
Market Structure
🟢 Beginner Friendly
How the Market Moves
Markets operate in repeating phases — trend, consolidation, liquidity sweep, and reversal. Identifying the current phase before entering is the single most important skill in trading.
💡
New to Trading? Start Here
Think of the market like a river. Sometimes it flows strongly in one direction (a trend). Sometimes it spreads wide and slow (consolidation). Your job is simple: find which way the river is flowing and swim with it — never against it. Everything in this module helps you read that direction.
Price Action — Market Phase Simulation
Uptrend Consolidation Breakout
📈
Trending Markets
Uptrend = higher highs + higher lows. Downtrend = lower highs + lower lows. Markets trend only 30% of the time. Identify the trend on the daily chart before touching lower timeframes.
🔄
Consolidation
Price moves sideways when buyers and sellers are balanced. Consolidation is not dead — it's energy coiling. The longer and tighter the range, the more explosive the breakout that follows.
💧
Liquidity Sweeps
Before major moves, price spikes past a key level to trigger stop losses — then reverses sharply. These are engineered by institutional players. The resulting wick is your signal, not your enemy.
Impulse & Correction
Impulse waves are fast and high-volume. Corrections are slow and shallow. Trade with the impulse. Enter during the correction. Never chase a candle that has already moved 80% of its range.
🕐
Market Sessions
Asian 00:00–08:00 UTC — tight ranges, low volume. London 08:00–16:00 UTC — highest volatility, major breakouts. New York 13:00–21:00 UTC — peak volume, trend continuation or reversals.
📊
Volume Confirmation
A breakout on high volume is real. A breakout on low volume is a trap. Volume validates price action. All Web5 bots filter entries by volume thresholds — low-volume signals are automatically rejected.
PhasePatternVolumeBot ActionBias
UptrendHH + HL, EMA fanning upRising on breakoutsLong bias onlyBullish
DowntrendLH + LL, EMA fanning downRising on breakdownsShort bias onlyBearish
ConsolidationEqual H/L, flat EMADecliningStandby — no entryNeutral
Liquidity SweepSpike + immediate reversal wickSpike on wickCounter-move after closeReversal
BreakoutClose beyond range + momentumSurge — confirms moveEnter retest of levelDirectional
Key Takeaways — Module 01
Determine trend direction on the Daily chart before opening any lower timeframe.
Markets consolidate 70% of the time. Patience during consolidation is a skill, not weakness.
Liquidity sweeps at key highs/lows are institutional setups — not random volatility.
Volume is the only indicator that cannot be faked. Always confirm direction with volume.
MODULE 02
Trade Execution
🟢 Beginner Friendly
How to Trade
Recognizing market structure is necessary but not sufficient. Professional traders follow a strict, repeatable process for every trade — from analysis to exit. No exceptions, no improvisation.
💡
Think of it Like a Checklist
Before a pilot flies a plane, they go through a checklist — every single time. Trading works the same way. These 7 steps are your pre-flight checklist. Skip one and you're flying blind. Follow all 7 and you trade like a professional — every time, no matter how you feel.
01
Top-Down Analysis — Start at the Highest Timeframe
Open the Daily chart. Is price above or below the 200 EMA? Is the structure printing higher highs or lower lows? Answer these before you look at any lower timeframe. Drop to 4H to confirm, then 1H for entry precision. Trading against the daily bias puts you against the largest market participants.
Daily → 4H → 1H
02
Mark Key Levels — Only the Ones That Matter
Draw horizontal lines at: previous day high/low, weekly high/low, major swing points, and psychological round numbers. Less is more — a chart with 20 lines tells you nothing. Identify the 3–5 levels price is most likely to react at and watch only those.
Swing Points · PDH/PDL · Round Numbers
03
Wait for Confirmation at Your Level
Price reaching a level is not a signal. Wait for confirmation: a pin bar, engulfing candle, a liquidity sweep and rejection, or a break-and-retest of the level. Most losing trades come from entering too early — before price proves its intention. Patience has a return on investment.
Pin Bar · Engulfing · Break & Retest
04
Define the Stop Loss Before Entering
Your stop loss goes where the trade thesis is disproven — below the swing low for longs, above the swing high for shorts. Use ATR to calibrate the distance. A trade without a pre-defined stop is not a trade — it is speculation without a plan.
ATR Stop Formula
Stop Distance = ATR(14) × multiplier (1.5–2.5×)
Long Stop = Entry Price − Stop Distance
Short Stop = Entry Price + Stop Distance
05
Calculate Position Size — 1–2% Risk Rule
Never risk more than 2% of your account on a single trade. This is non-negotiable. With proper position sizing, 10 consecutive losses only reduces your account by ~18%. Without it, 5 losing trades can wipe out 50% of capital.
Position Size Formula
Risk Amount = Account Balance × 0.01 (1%)
Position Size = Risk Amount ÷ (Stop Distance × Pip Value)
06
Minimum 1:2 Risk-to-Reward Ratio
Only accept trades where the potential gain is at least twice the risk. At 1:2 R:R, you only need to win 34% of your trades to break even. Most retail traders have excellent win rates and lose money because their R:R is below 1:1. The math must work before you enter.
Target ≥ 2× Stop Distance
07
Manage the Trade — Protect Profits Systematically
Once the trade moves 1R in your favor, move the stop to break-even — this trade can no longer lose. At 1.5R, begin trailing the stop to lock in gains. Scale out 50% at the first target. Let the remaining position run to the second target. Never move a stop further away from your entry to avoid a loss.
Break-Even at 1R · Trail at 1.5R · Scale Out
How Web5 Bots Automate This Process
Every Web5 bot executes this 7-step framework automatically — 24 hours a day, across every session, with zero emotional interference. ATR-based stops, 1% risk sizing, and minimum 1:2 R:R are hardcoded into every strategy. The bot does not deviate. You set it once and it executes with institutional-grade discipline.
Key Takeaways — Module 02
Always start analysis on the Daily chart — trade the trend, not against it.
Never enter without a stop loss placed at a technically significant level.
Risk 1–2% per trade maximum. Position size is calculated from risk, not gut feeling.
Refuse any setup with less than 1:2 risk-to-reward. The math must work before entry.
Move stop to break-even at 1R profit — eliminate risk from the trade entirely.
MODULE 03
Target Identification
🟡 Intermediate
How to Locate Your Target
Entry precision is half the equation. Where you exit determines whether a good trade becomes a profitable trade. Identify targets before entry — not after price is already moving.
🎯
Simple Version — Where Does Price Want to Go?
Before you enter any trade, ask: "Where is the nearest wall?" Price moves toward areas where lots of orders are waiting. Your job is to find those walls — support levels below you, resistance levels above you — and set your profit target just before price hits them. Never guess. Always identify the level first.
Trade Anatomy — Entry · Stop · Target Levels
Entry Zone Stop Loss Targets
🎯
Previous Swing High / Low
The most consistent targets are unmitigated swing highs (for long trades) and swing lows (for short trades). These are levels where institutional orders were originally placed and not yet re-tested from the opposite side. Price gravitates back to these with high reliability.
🔢
Psychological Round Numbers
EUR/USD 1.1000, Gold $2,500, Bitcoin $100,000 — these attract massive order clusters from retail and institutional players simultaneously. Price frequently pauses, reverses, or accelerates at these levels. Always mark them before entering any trade in that vicinity.
📐
Fibonacci Extension Levels
Draw Fibonacci from the last significant swing low to swing high. The 1.272 and 1.618 extensions are institutional exhaustion zones — where professional traders place profit targets and hedge funds close positions. Web5 bots calculate these automatically on every confirmed setup.
📊
Supply and Demand Zones
A supply zone is where price dropped sharply from — unfilled sell orders remain at that level. A demand zone is where price rallied sharply from. When price returns to these zones, the institutional orders that created the original move get triggered again, driving rapid moves in the same direction.
🧲
Liquidity Pool Targets
Stop losses cluster at predictable locations: below swing lows, below round numbers, below trendlines. Institutions target these pools to fill large orders. Identifying where retail stops are concentrated reveals where institutional price targets are set — because that is exactly where they are driving price.
📏
Measured Move Projection
When price breaks from a range or pattern, the expected move equals the height of that range projected from the breakout point. A 150-pip consolidation that breaks upward targets 150 pips above the break level. Simple, reliable, and consistent across all markets and timeframes.
⚠ Rule — Define Your Exit Before Your Entry
Before clicking Buy or Sell, you must know exactly: (1) where your stop is, (2) where your target is, (3) what the R:R ratio is. If you cannot answer all three in under 15 seconds, you are not ready to enter. Chasing targets after entry leads to emotional decision-making and poor risk management. Plan the trade. Trade the plan.
Key Takeaways — Module 03
Target the previous swing high (longs) or swing low (shorts) as the primary objective.
Round numbers and psychological levels attract institutional order flow — always mark them.
Fibonacci 1.272 and 1.618 extensions are where trends commonly exhaust — use as second targets.
Supply and demand zones show where unfilled institutional orders remain — high-probability reaction areas.
Never identify targets after you are already in the trade. Pre-define or don't enter.
MODULE 04
Strategy Validation
🟡 Intermediate
How to Back-Test the Bots
No strategy should be deployed on live capital without validation. Backtesting runs your bot across years of historical data — exposing weaknesses, optimizing parameters, and confirming statistical edge before a single dollar is risked.
01
Open TradingView — Load the Pine Script
Navigate to TradingView → open a chart for the market the bot is designed for. Click Pine Editor at the bottom panel. Paste the Web5 Pine Script. Click "Add to chart." Buy and sell signals will appear on the price chart immediately — these are the historical entry points.
TradingView → Pine Editor → Add to Chart
02
Open the Strategy Tester Tab
Click "Strategy Tester" adjacent to Pine Editor at the bottom of the screen. The Performance Summary tab shows aggregate results. The List of Trades tab shows every individual trade — entry, exit, profit/loss, and duration. This is your bot's full historical report card.
Strategy Tester → Performance Summary → Trade List
03
Select the Correct Timeframe and Date Range
Test on a minimum of 2 years of data. Use the timeframe the bot is designed for: 15M–1H for scalping strategies, 4H–Daily for swing strategies. Short backtests produce misleading results — a strategy may look exceptional on 3 months but fail across 2 years. Always include both trending and ranging market periods in the test window.
Minimum 2 Years · Correct Timeframe · Multiple Conditions
04
Evaluate the Five Core Metrics
Only five numbers determine whether a strategy has genuine edge. Everything else is noise.
Validation Criteria
Net ProfitMust be positive over full test period
Total TradesMinimum 100 for statistical validity
Profit FactorGross Profit ÷ Gross Loss — target > 1.5
Max DrawdownMust not exceed 20% of starting equity
Win RateAbove 40% with 1:2 R:R is mathematically profitable
05
Optimize Parameters — One Variable at a Time
Adjust one input at a time: EMA period, ATR multiplier, RSI threshold. Run the full backtest after each change. If the strategy performance changes dramatically with a small parameter shift — it is fragile and unreliable in live markets. A robust strategy performs consistently across a range of values, not only at a single "magic" setting.
One Variable · Full Test · Robustness Check
06
Forward Test on a Demo Account — 30 Days Minimum
After a passing backtest, run the bot live on a demo account for at least 30 days. This is forward testing — real market conditions with real-time spreads, slippage, and execution. If forward test results match the backtest within 20% variance, the strategy is validated for live deployment. Risk no more than 0.5% per trade during forward testing.
Demo Account · 30 Days · 0.5% Risk During Test
MetricResultBenchmarkStatus
Net Profit (2yr)+$18,420> $0✓ Pass
Total Trades347> 100✓ Pass
Win Rate53.6%> 40%✓ Pass
Profit Factor1.87> 1.5✓ Pass
Max Drawdown−14.2%< 20%✓ Pass
Avg Win / Avg Loss2.1 R> 1.5 R✓ Pass
Sharpe Ratio1.34> 1.0✓ Pass
Recovery Factor3.2×> 2.0×✓ Pass
Sample results — GoldStrike EA on XAU/USD · 2-year simulation. Past performance does not guarantee future results.
⚠ Backtesting Limitation
Backtests reflect historical market conditions. A strategy validated on 2018–2024 data will encounter market regimes it has never seen. Treat backtest results as a lower-bound estimate of live performance. Always forward test before deploying capital. Never increase position size beyond 1% per trade until the strategy has a minimum 3-month live track record.
Key Takeaways — Module 04
Backtest on a minimum of 2 years across multiple market conditions — not cherry-picked periods.
100+ trades required for statistically meaningful results. Fewer trades = unreliable data.
Profit Factor above 1.5 and Max Drawdown below 20% are the two most important filters.
Optimize one parameter at a time. Curve-fitting to historical data produces strategies that fail live.
30-day demo forward test is mandatory before any live capital is deployed on a new strategy.
MODULE 05
Price Action Signals
🟢 Beginner Friendly
Candlestick Patterns
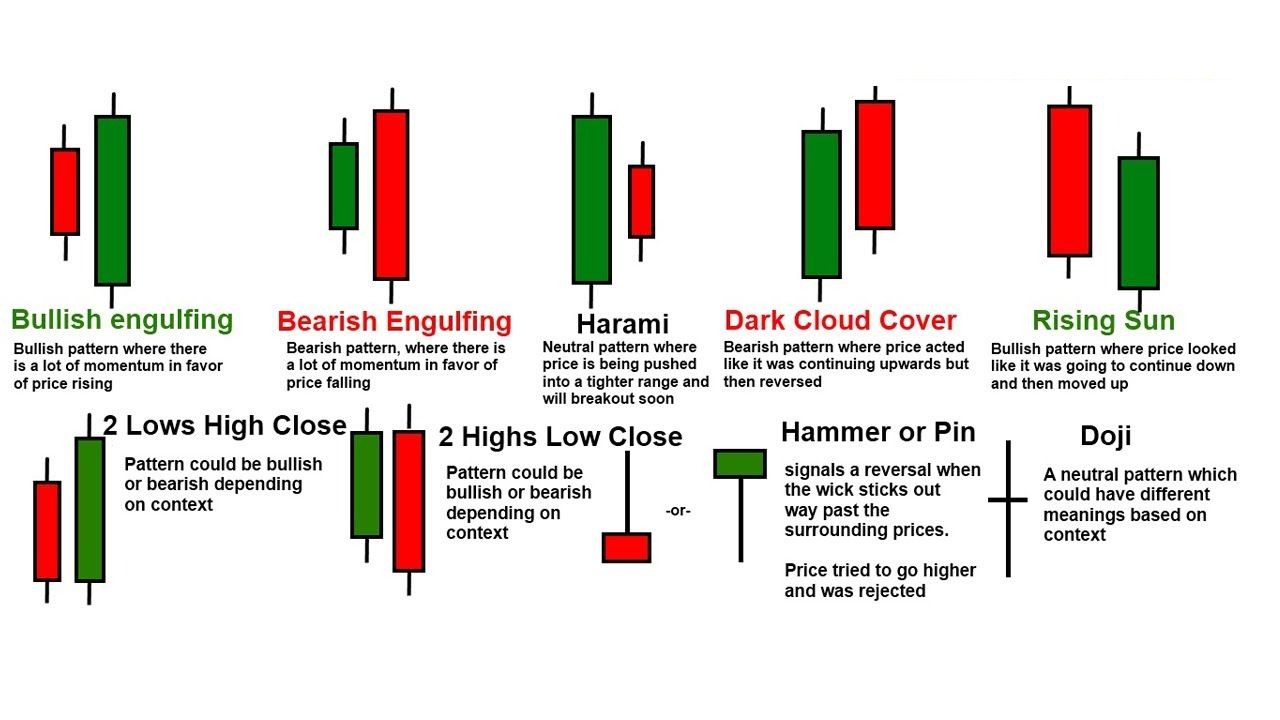
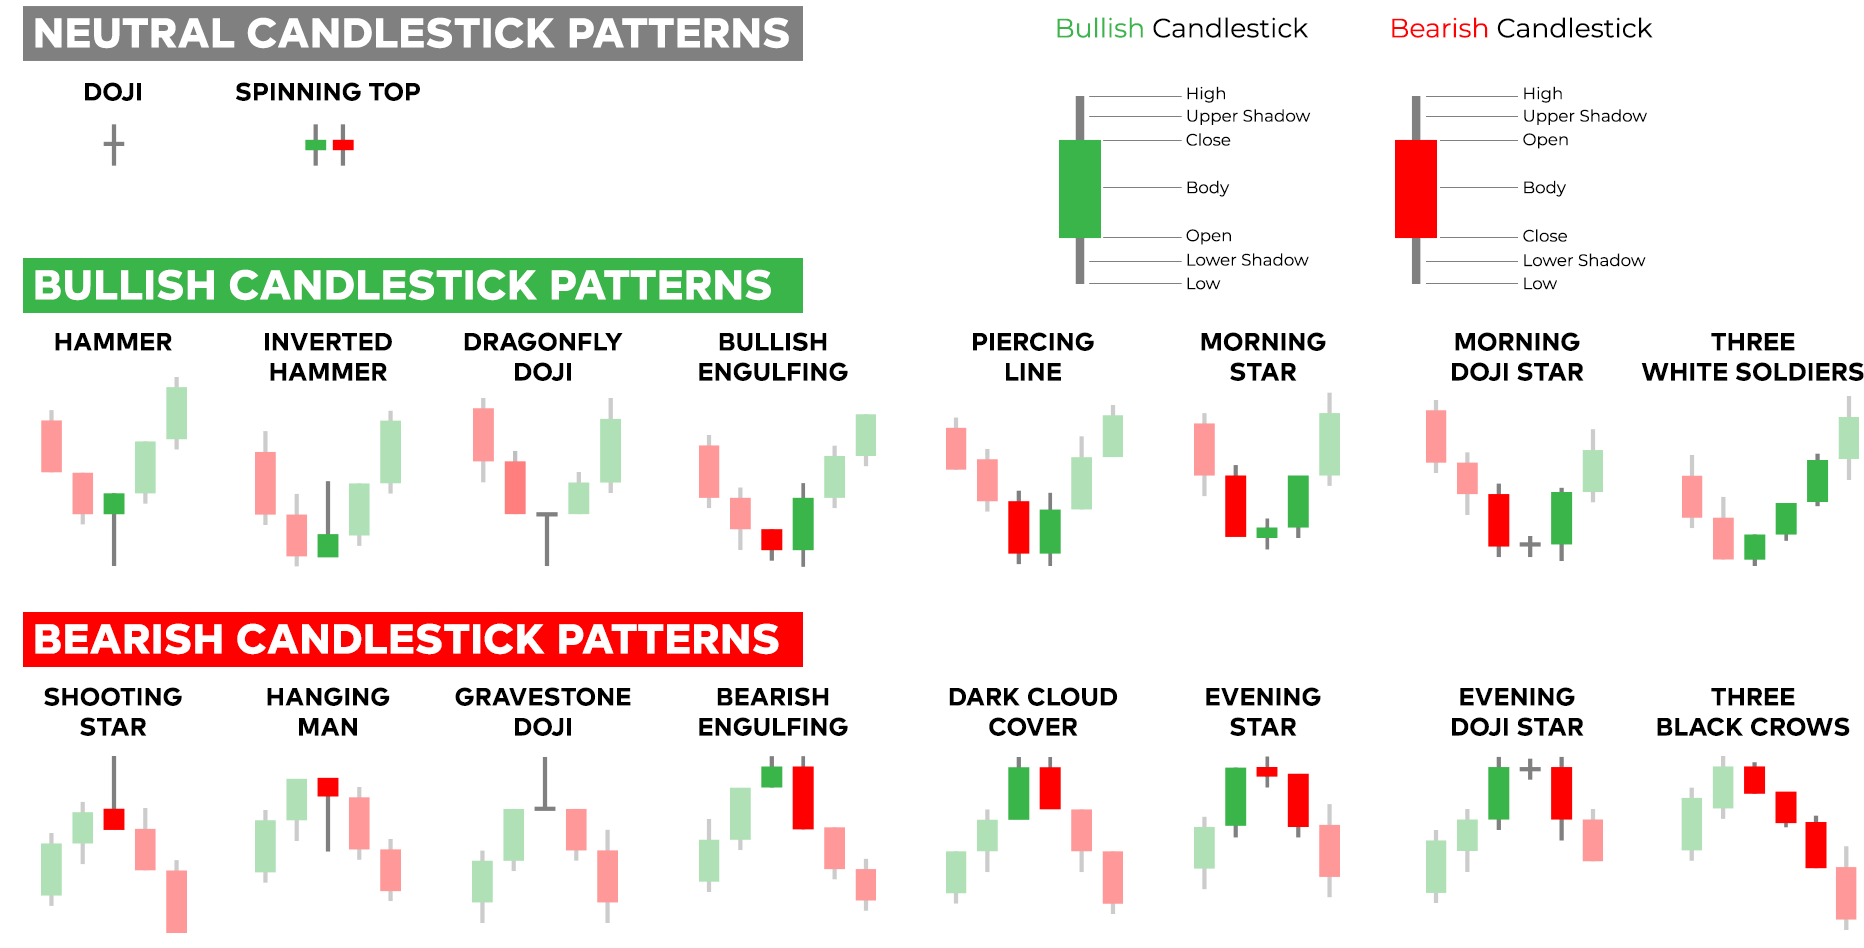
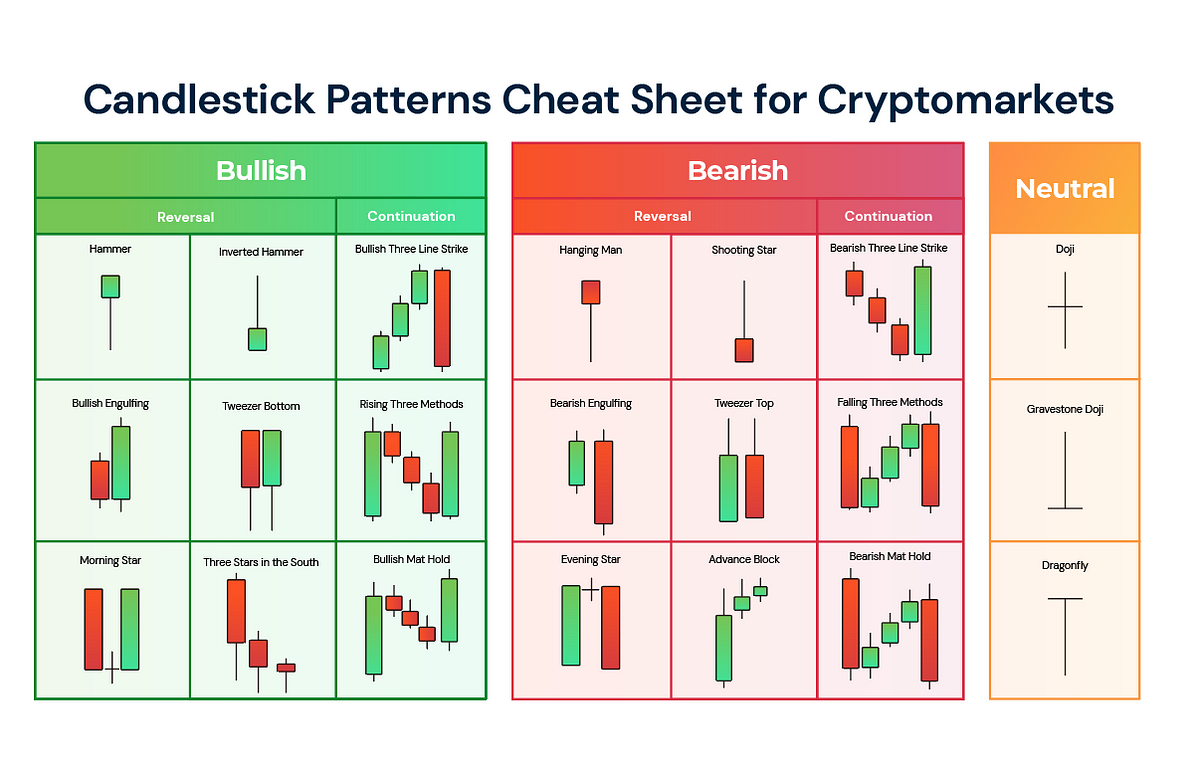
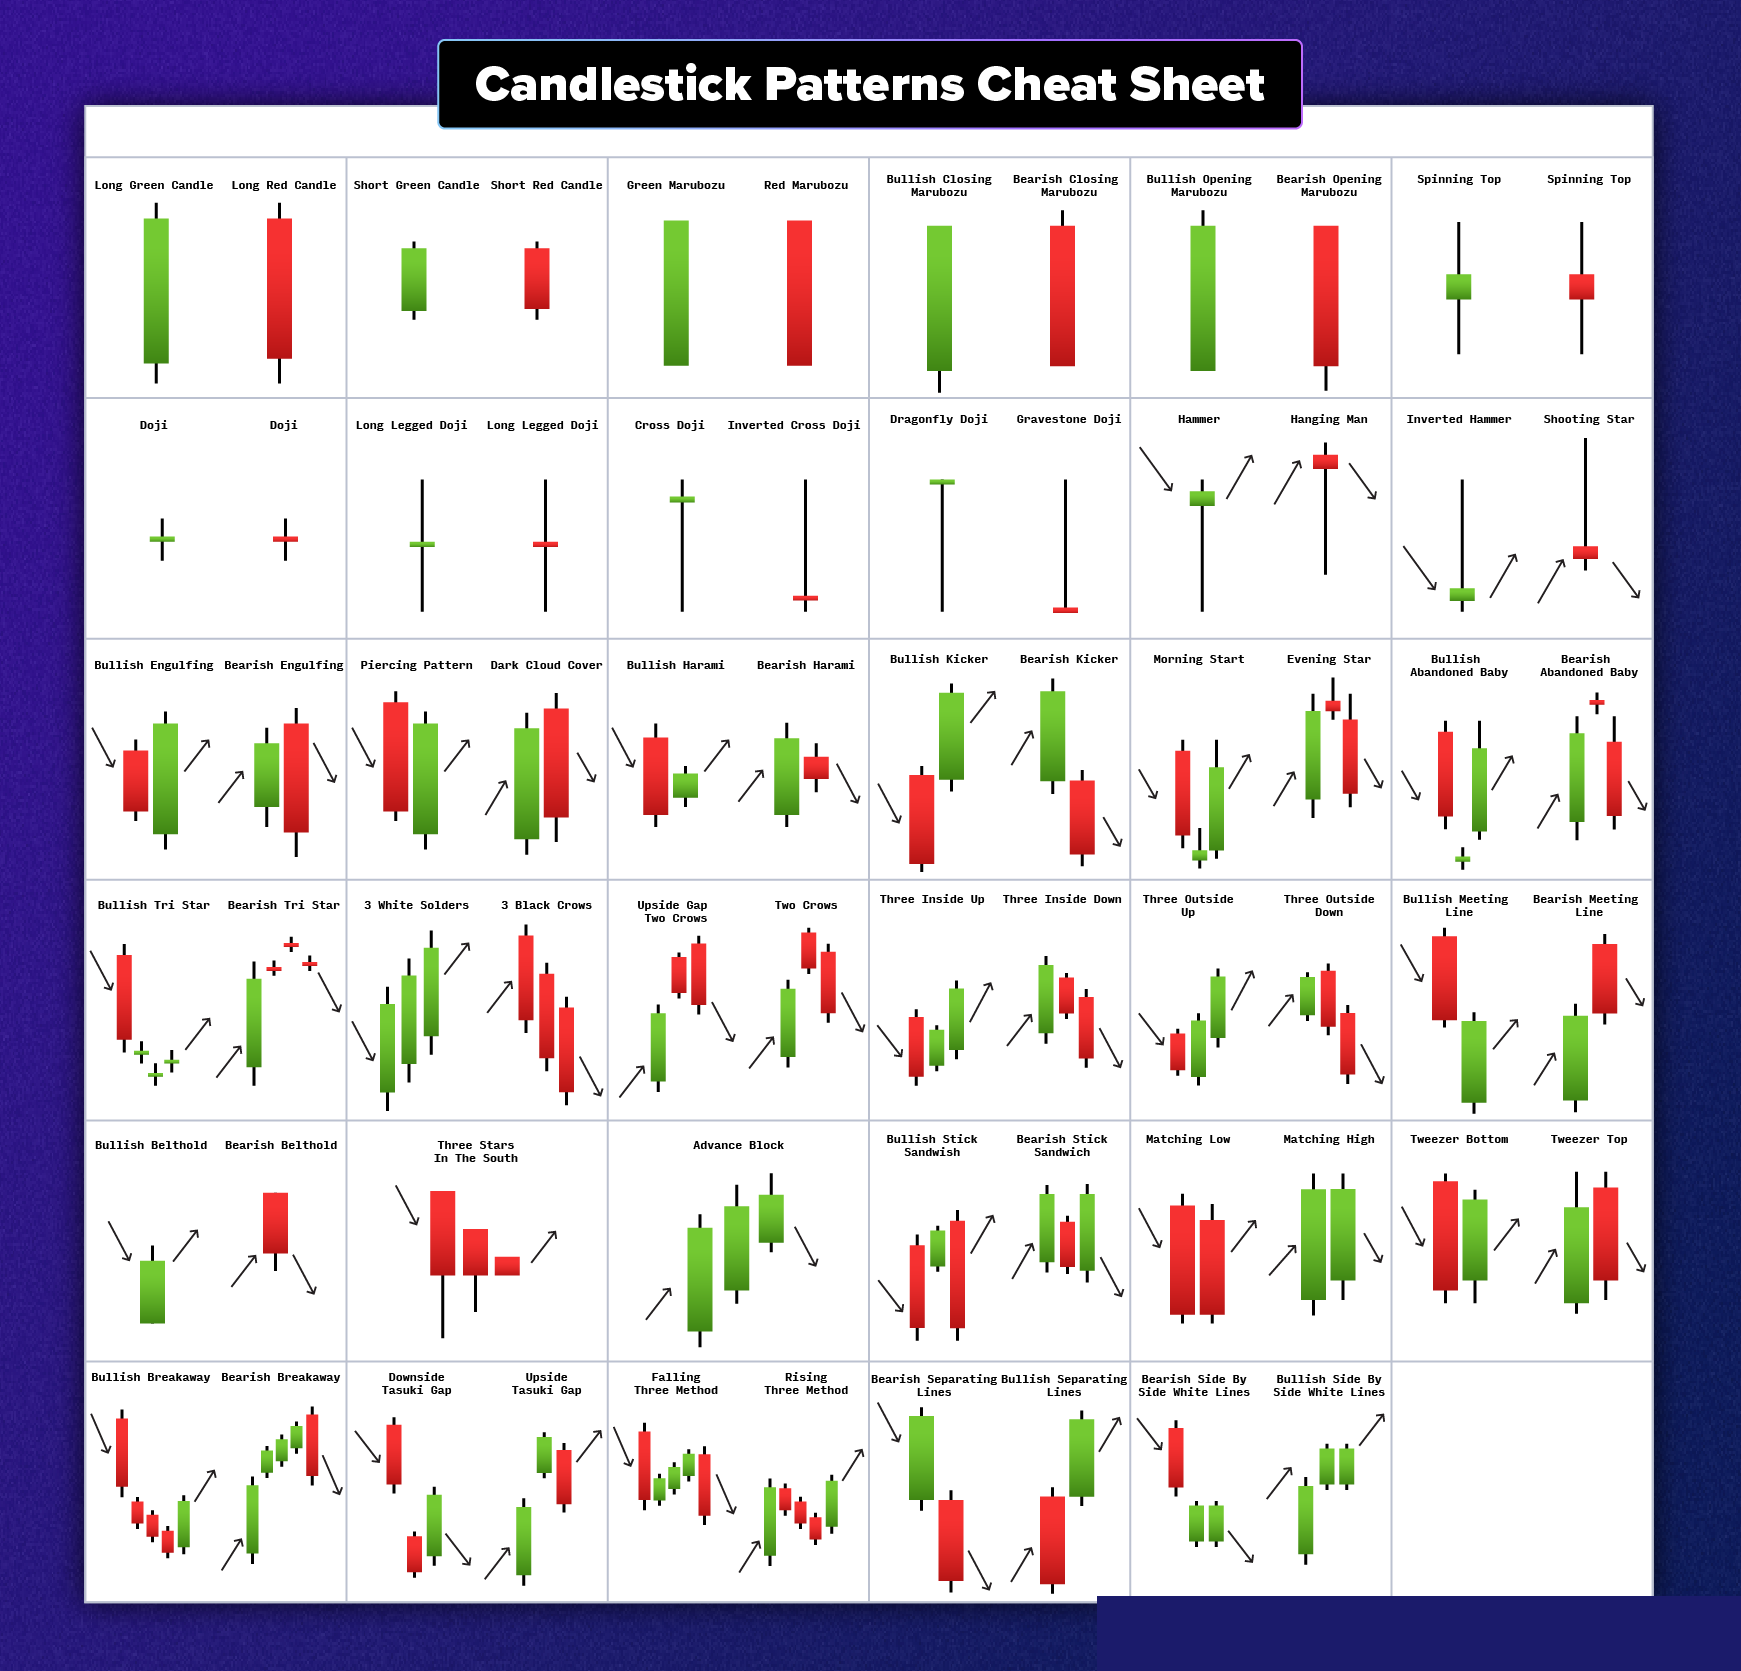
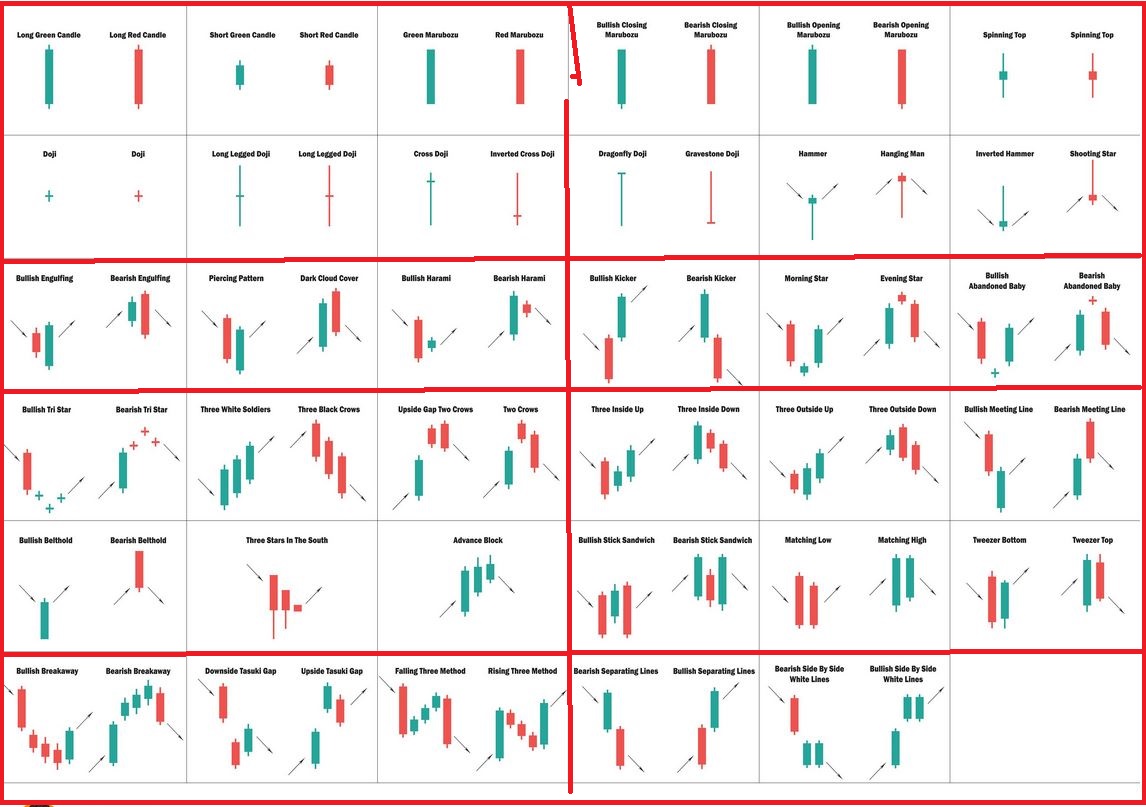
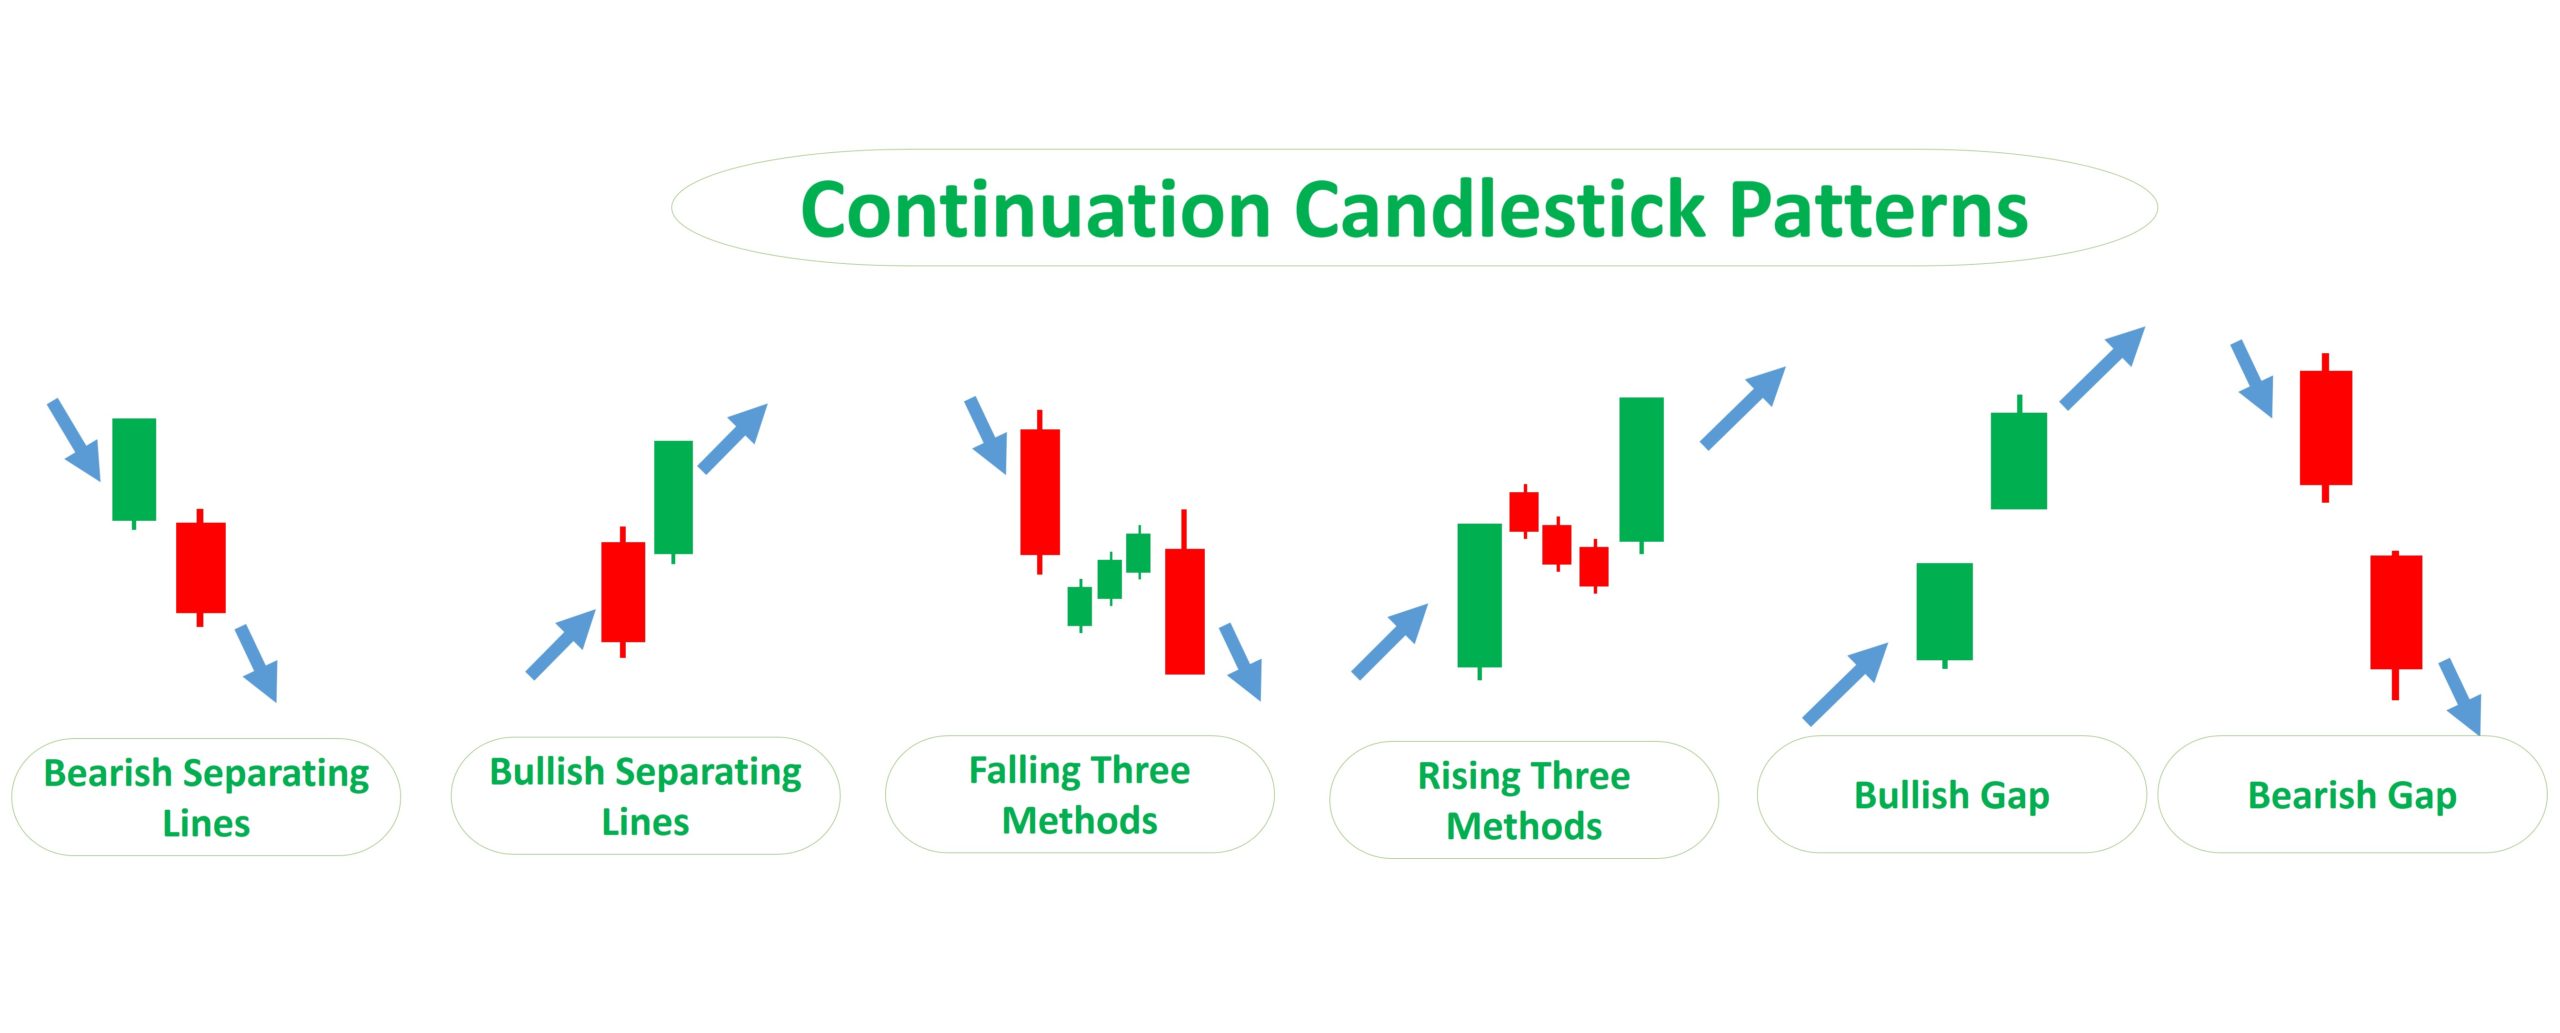
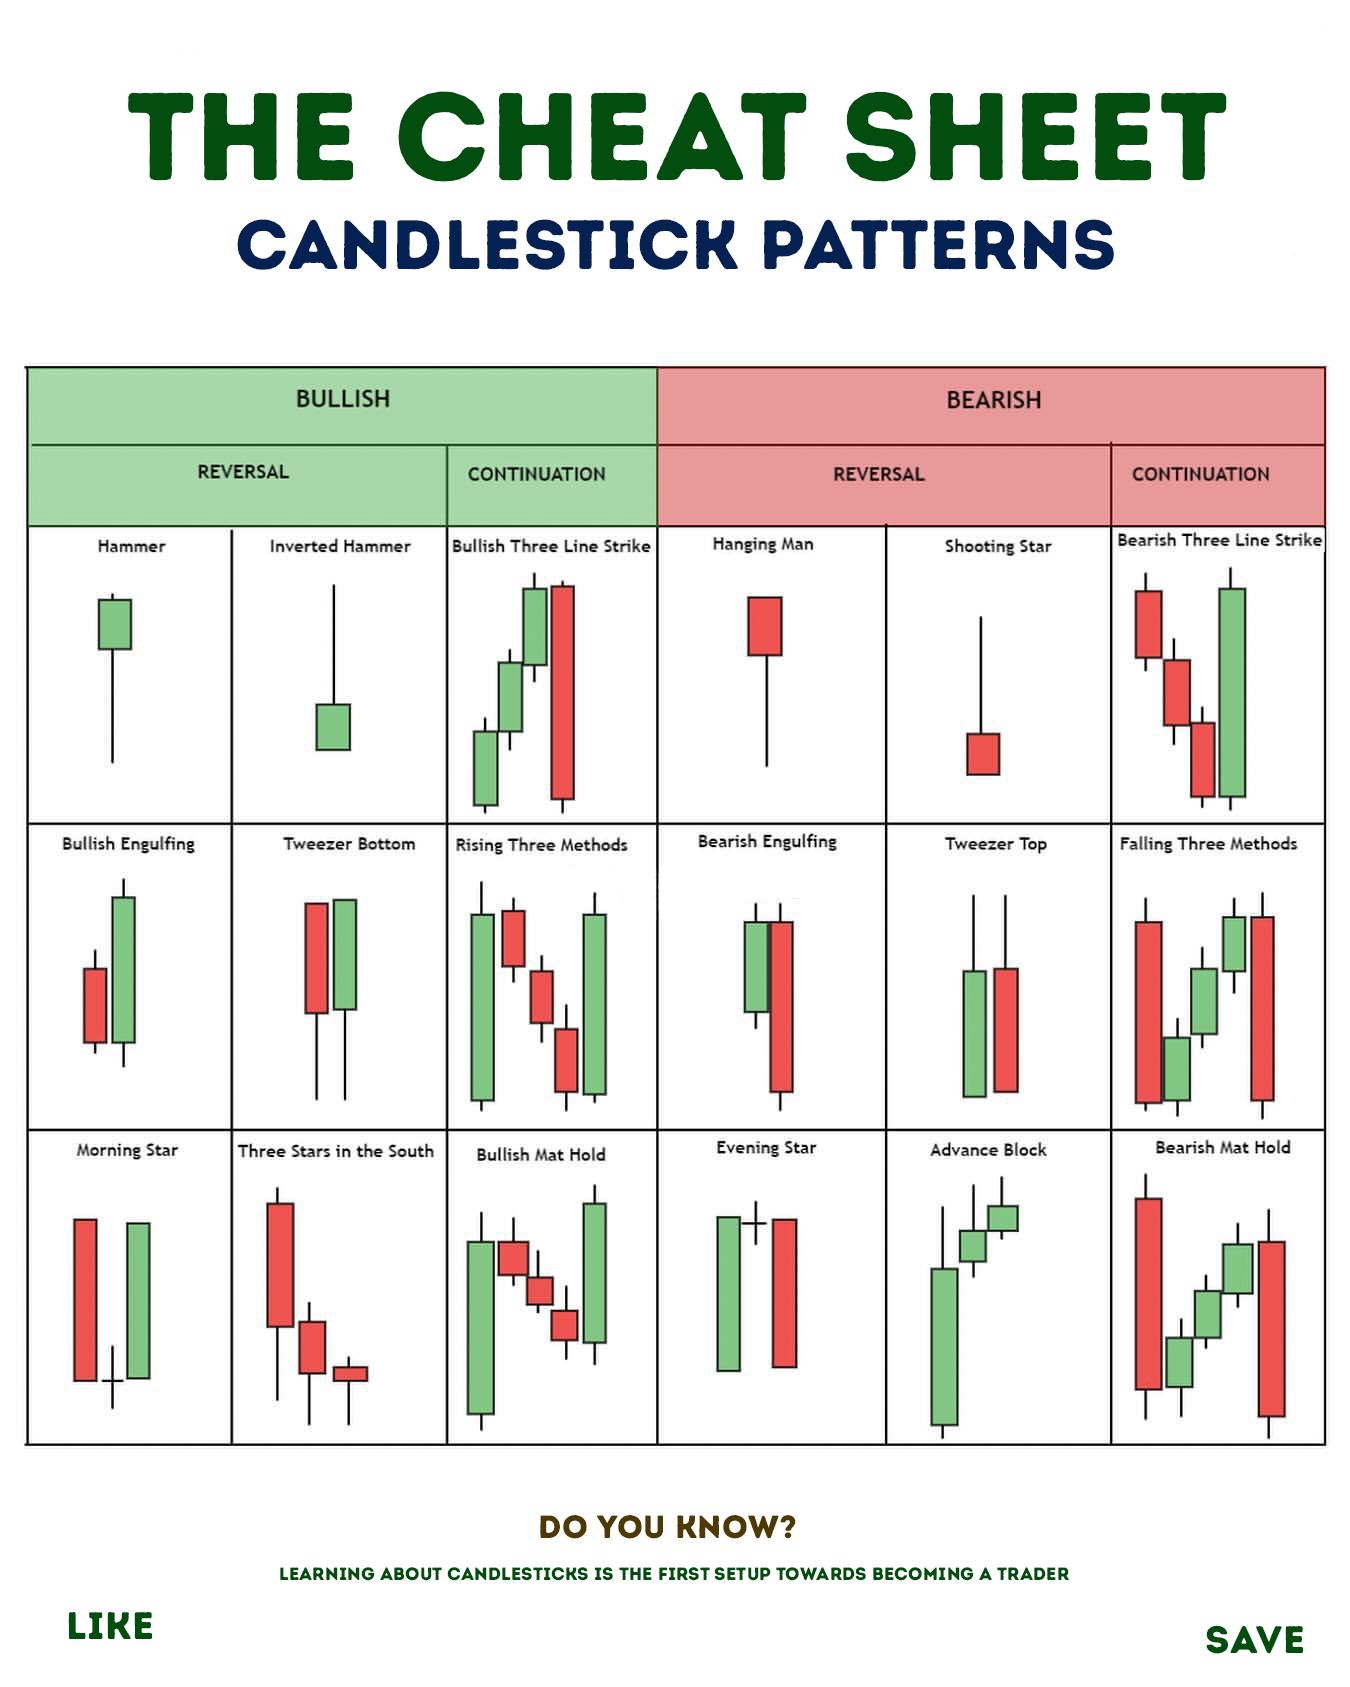
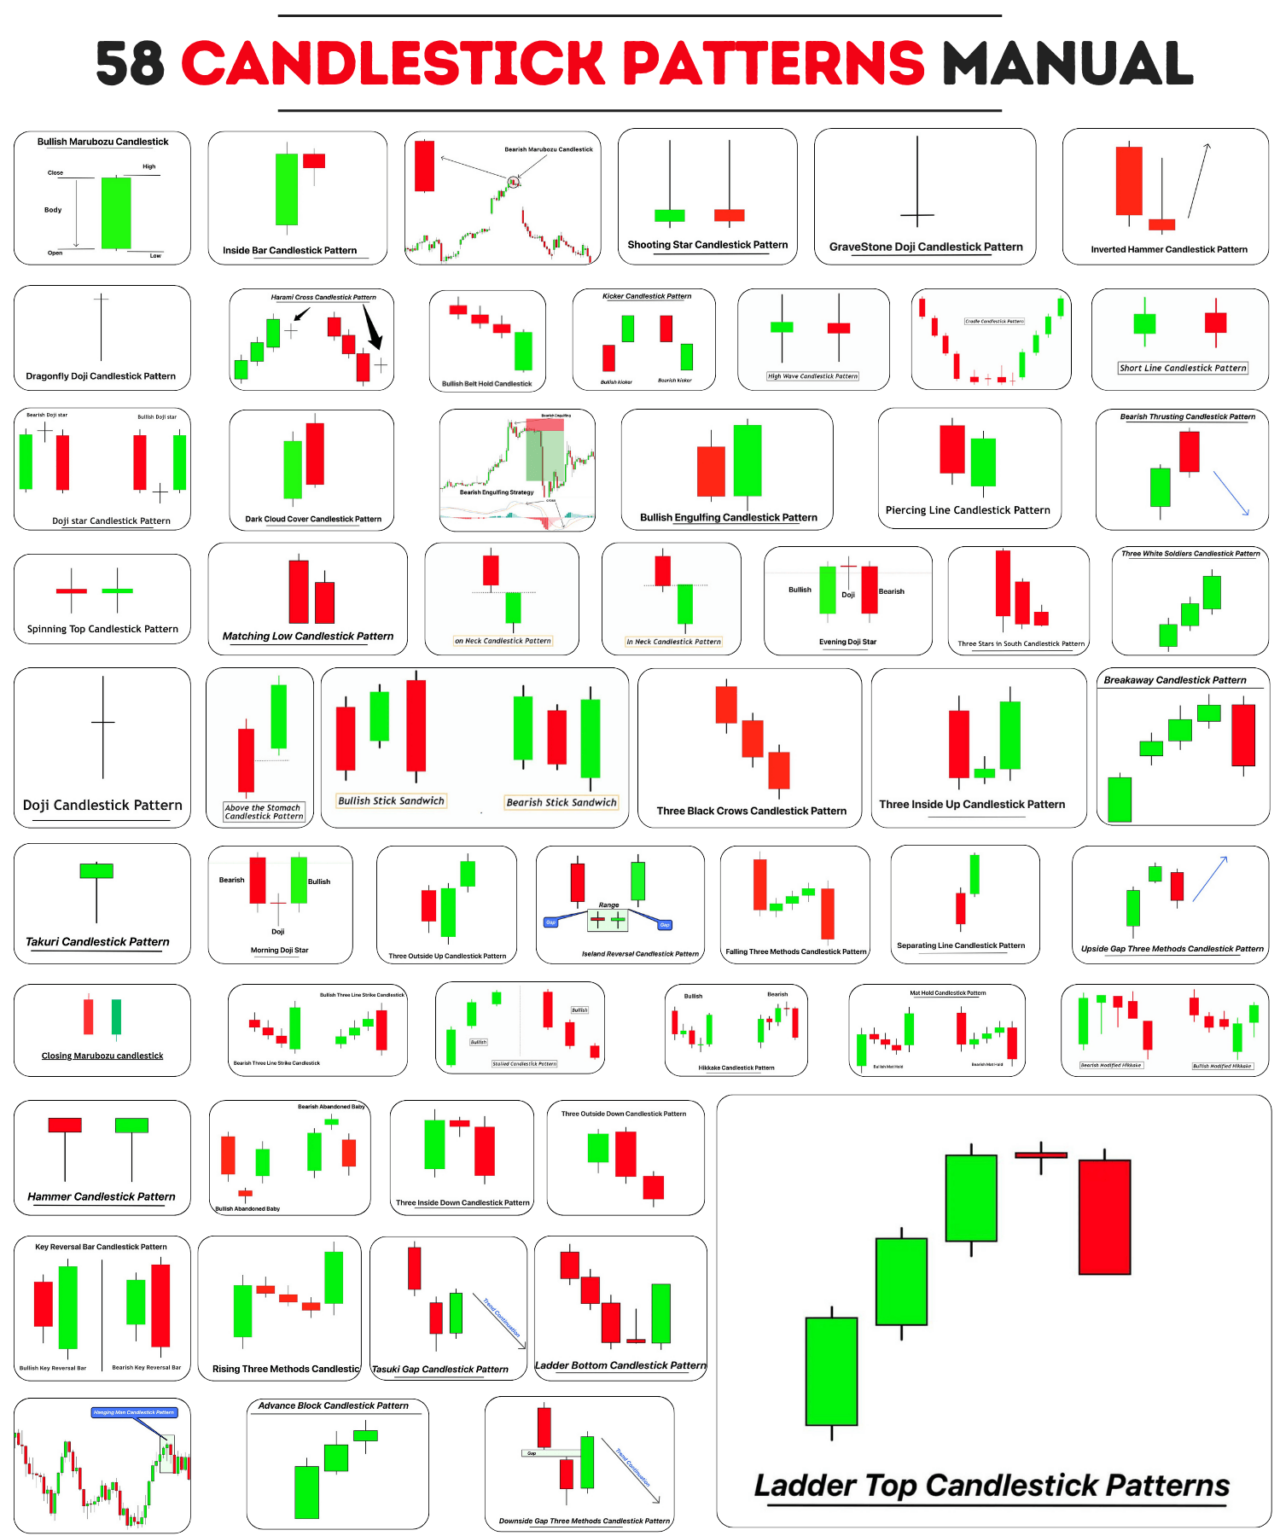
Candlesticks are the language of the market. Each pattern communicates the balance of power between buyers and sellers at that moment in time. Reading them accurately is the foundation of price action trading.
💡
What Is a Candlestick?
Every candle on your chart shows 4 things: where price opened, where it closed, the highest point it reached, and the lowest point. The body (thick part) shows open vs close. The wicks (thin lines) show the highest and lowest prices. A green/white candle = price went up. A red/black candle = price went down. That's it — now you can read any chart.
📌
Pin Bar (Hammer / Shooting Star)
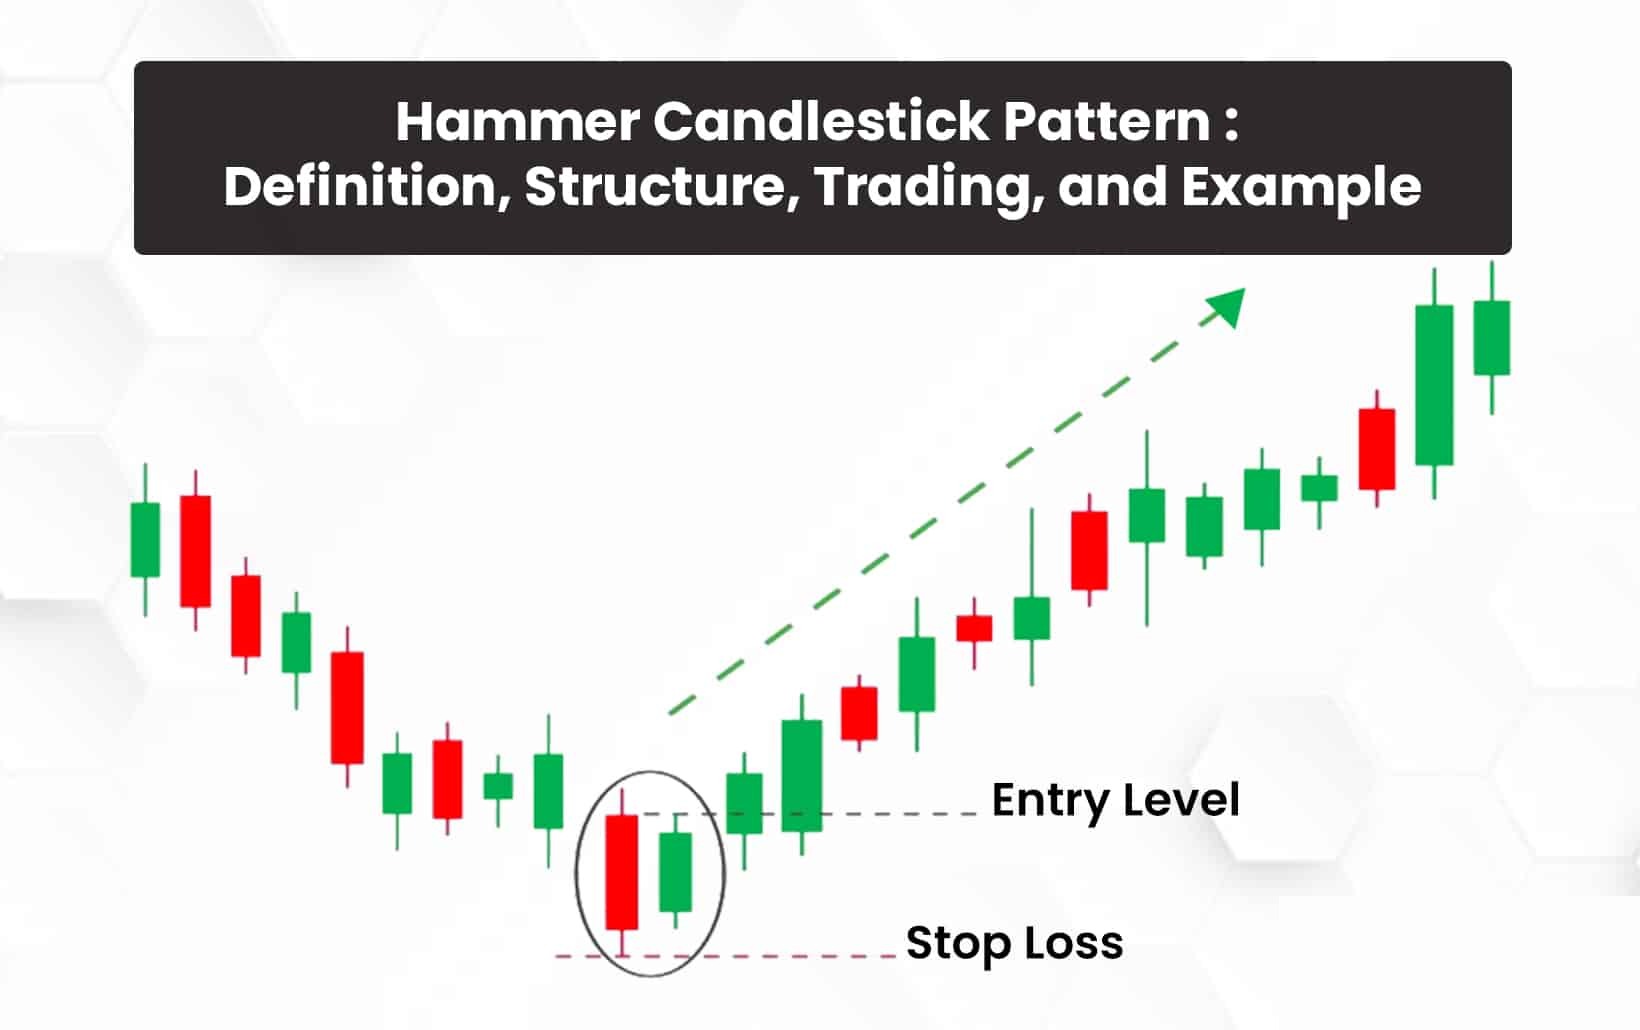
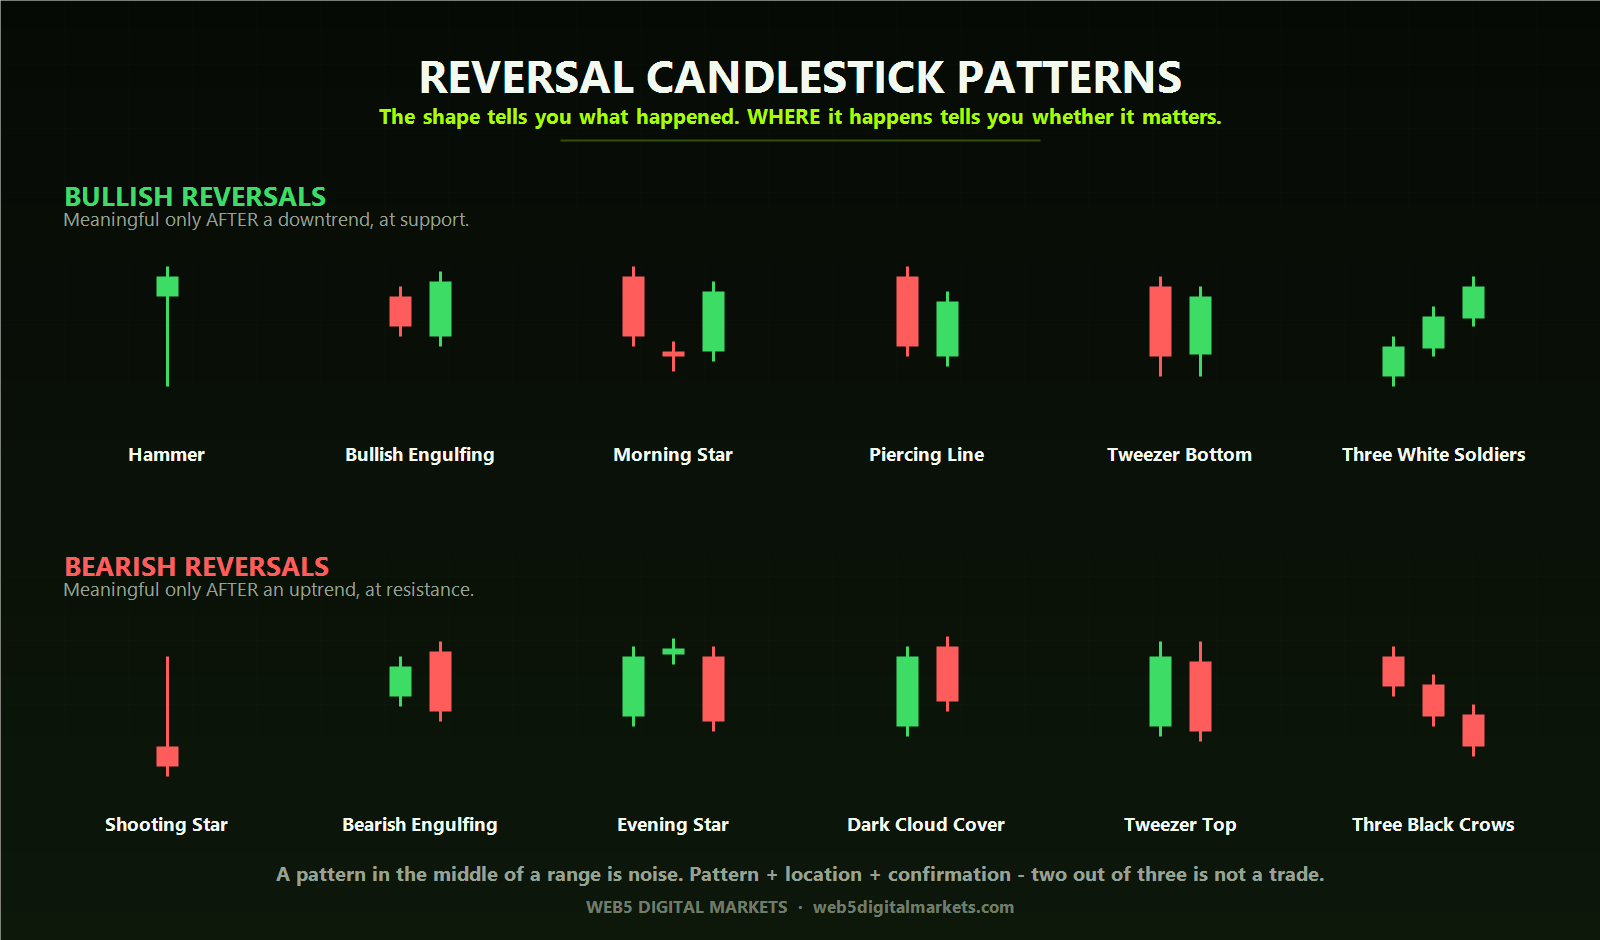
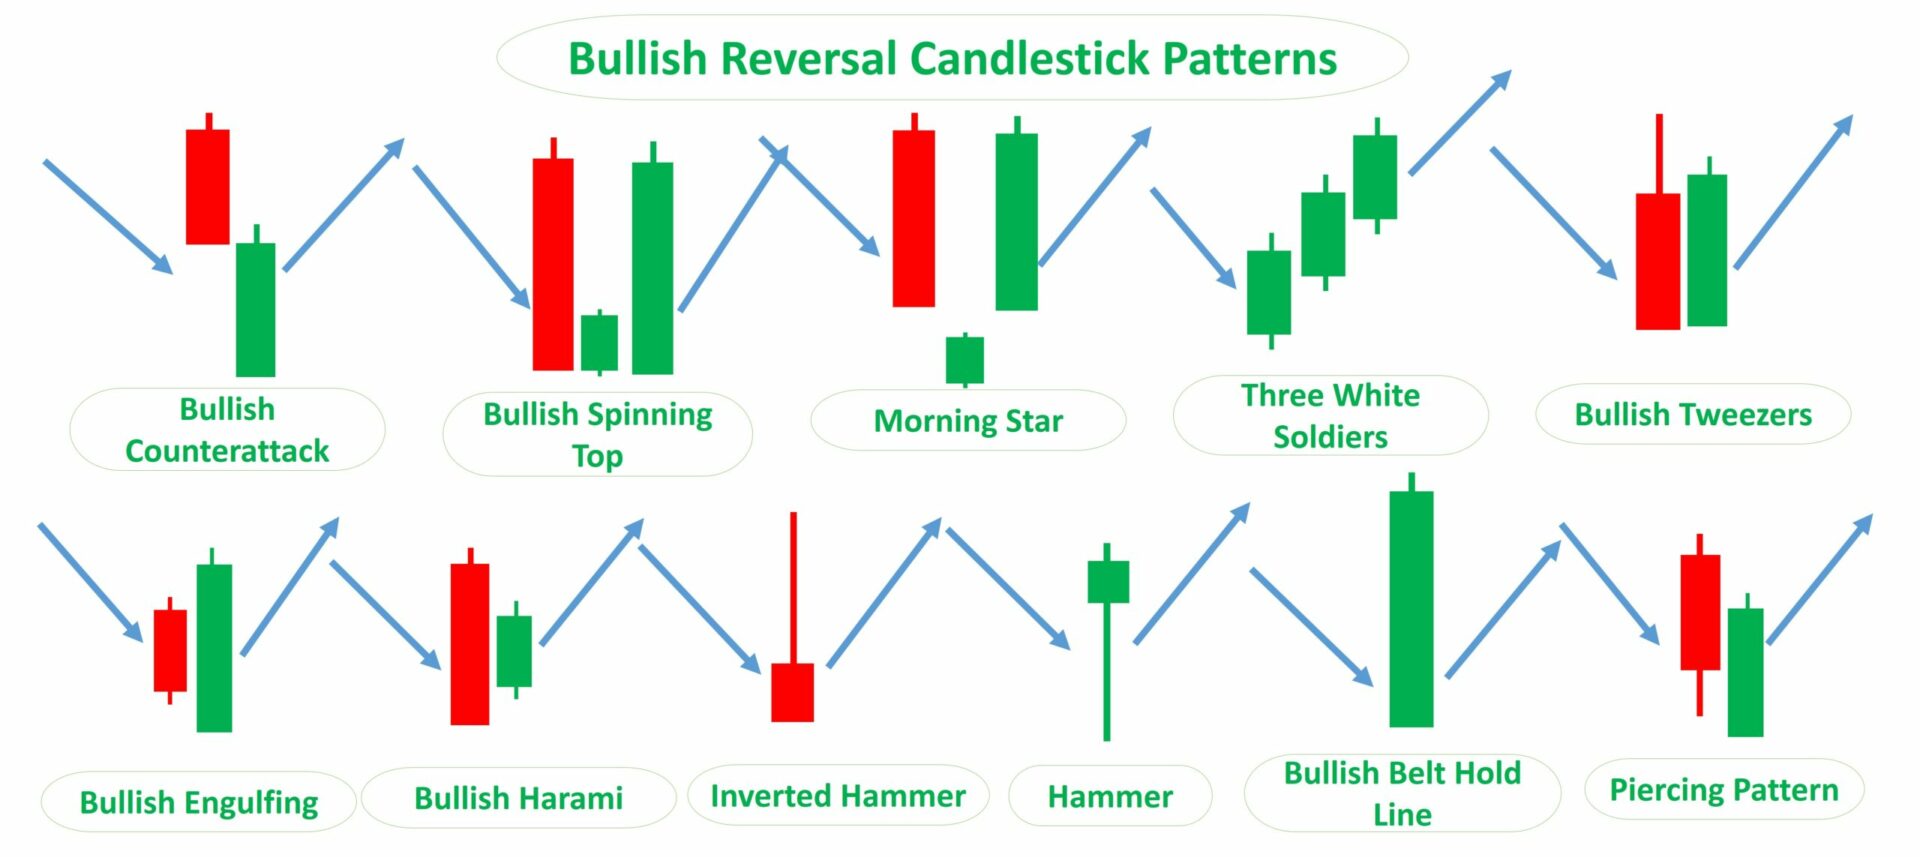
A long wick with a small body signals rejection of a level. Bullish pin bar: long lower wick — buyers rejected lower prices aggressively. Bearish pin bar: long upper wick — sellers rejected higher prices. Most reliable at key support/resistance levels.
🕯️
Engulfing Candle
A candle that fully covers the body of the previous candle. Bullish engulfing: large green candle swallows a red candle — momentum shift to buyers. Bearish engulfing: large red candle swallows a green candle — sellers taking control. High-probability when at key levels.
〰️
Doji — Indecision
Open and close are nearly equal — the market is undecided. A Doji after a strong trend signals exhaustion and potential reversal. A Doji during consolidation is meaningless. Context is everything — the Doji is only powerful when it appears at a significant level after a clear trend move.
📦
Inside Bar — Compression
The entire candle fits within the high-low range of the previous candle. This represents market compression — energy building before a directional move. Trade the breakout of the inside bar in the direction of the dominant trend. Web5 bots detect inside bar compression as a pre-entry signal.
🌅
Morning / Evening Star
A 3-candle reversal pattern. Morning Star at a low: large red candle → small indecision candle → large green candle = strong bullish reversal. Evening Star at a high: the mirror image = strong bearish reversal. One of the highest-probability reversal patterns in technical analysis.
Marubozu — Pure Momentum
A full-bodied candle with no wicks — open equals high (bearish) or open equals low (bullish). This signals complete domination by one side. A bullish Marubozu closing above a resistance level is one of the strongest breakout confirmation signals. Don't trade against a Marubozu candle.
Pattern + Location = High Probability
A pin bar in the middle of a range is meaningless. A pin bar at a major daily support level during the London open after a liquidity sweep — that is a high-probability setup. Candlestick patterns derive their power from context: where they form, what timeframe, and what preceded them. Never trade patterns in isolation.
Key Takeaways — Module 05
Pin bars at key levels signal strong rejection — the longer the wick, the stronger the rejection.
Engulfing candles show momentum shifts — most powerful after extended moves in one direction.
A Doji only matters at key levels after a clear trend — context determines significance.
Inside bars signal compression before expansion — trade the breakout in the trend direction.
Never trade a candlestick pattern without knowing what support/resistance it formed at.
MODULE 06
Mental Edge
🟢 Most Important Module
Trading Psychology & Mindset
Technical skill alone does not produce profitable traders. Studies consistently show that psychology accounts for 80% of trading outcomes. Emotion is the enemy of execution — discipline is the edge.
😨
Fear of Missing Out (FOMO)
Chasing trades that have already moved is the most common retail mistake. A trade missed is not a loss — it is capital preserved. If you missed the entry, wait for the next setup. There are thousands of setups every week across all markets. Discipline means letting bad setups pass without entering.
🎰
Revenge Trading
Entering a trade immediately after a loss to "make it back" is revenge trading — the fastest way to blow an account. Each trade is independent. A loss on trade #47 has zero statistical relationship to trade #48. Close the platform after a losing trade. Return with a clear mind. Never trade in anger or frustration.
💎
Holding Losers Too Long
Moving a stop further away to "give the trade more room" is a critical error. Your stop is placed at the level where the trade is wrong — if price reaches it, the trade is wrong. Accepting small losses is professional trading. Turning a small loss into a catastrophic loss is amateur trading. Honor your stops without exception.
📒
The Trading Journal
Every trade should be recorded: entry, exit, reason, result, and emotional state at entry. Review weekly. You will discover patterns in your losses — specific times, setups, or emotional states that correlate with poor performance. The journal is your personal performance data. Traders who journal improve; those who don't repeat mistakes indefinitely.
🔁
Process Over Outcome
A trade that follows your rules exactly but loses is a good trade. A trade that breaks your rules and profits is a bad trade. Professional traders measure themselves on process adherence, not P&L from individual trades. The edge only reveals itself over hundreds of trades — not in a single session.
⏸️
Daily Loss Limits — Walk Away Rules
Set a maximum daily loss before you begin trading — typically 3–5% of account. If you hit this limit, stop trading for the day without exception. This rule has saved more accounts than any indicator. Institutional traders have mandatory walk-away rules enforced by risk departments. Apply the same standard to yourself.
Trading Journal — What to Record Every Trade
Date & TimeEntry and exit timestamps
InstrumentEUR/USD, XAU/USD, BTC/USD etc.
DirectionLong or Short
Entry PriceExact entry level
Stop LossPre-defined stop level
TargetPre-defined exit level
ResultWin / Loss · Pips / $ P&L · R multiple
ReasonWhy you took the trade — setup description
Emotional StateCalm / Anxious / Confident / Rushed
Key Takeaways — Module 06
A missed trade is not a loss — it is capital protected. Another setup always follows.
Never trade immediately after a loss. Close the platform and return with a clear mind.
Honor every stop loss without exception. The stop is where you are wrong — accept it.
Keep a trading journal for every trade. Review it weekly and identify recurring patterns in losses.
Set a daily maximum loss limit (3–5%). Hit it — stop trading. No exceptions.
MODULE 07
Fundamental Catalysts
🟡 Intermediate
News Events & Economic Data
Economic data releases move markets more in 60 seconds than technical setups move them in 60 hours. Understanding the calendar and knowing which events to trade — and which to avoid — is a professional requirement.
EventMarket ImpactFrequencyKey MarketsVolatility
NFP — Non-Farm PayrollsJobs data — economy strengthMonthly (1st Friday)USD pairs, Gold, IndicesExtreme
FOMC — Fed Rate DecisionInterest rate policy — USD direction8× per yearAll USD pairs, Gold, StocksExtreme
CPI — Inflation DataPrice pressure — rate expectationsMonthlyUSD, Gold, BondsHigh
GDP — Growth DataEconomic output — currency strengthQuarterlyDomestic currency pairsHigh
Retail SalesConsumer spending — growth signalMonthlyUSD pairs, IndicesMedium
PMI — Manufacturing / ServicesBusiness activity — growth/contractionMonthlyEUR, GBP, USD pairsMedium
Central Bank SpeechesRate guidance — forward policy signalsVariableAll marketsUnpredictable
Trading News Events — When To
Wait for the initial spike and counter-spike to complete (usually 2–5 minutes after release). Then trade the direction of the dominant move once price stabilizes. The "fade the spike" strategy — trading against the initial overreaction — is used by experienced traders after large surprise misses or beats.
🚫
When to Stand Aside
NFP, FOMC rate decisions, and major central bank speeches generate spreads 5–20× normal size and price can move 100–300 pips in seconds. For new traders: close all positions 15 minutes before red-folder events and re-enter after volatility settles. Web5 bots have built-in news filters that pause trading during high-impact events.
⚠ News Filter — Web5 Bot Behavior
All Web5 bots are built with configurable news filters. When a high-impact event is detected on the economic calendar, the bot automatically pauses new entries 30 minutes before and 30 minutes after the release. Existing positions remain open with their stop losses active. This prevents the bot from entering trades during unpredictable spike conditions.
Key Takeaways — Module 07
Check the economic calendar every morning before trading — know what red-folder events are scheduled.
NFP and FOMC are the two highest-impact events — never hold unprotected positions into these releases.
Trade the direction of the post-news move after the spike settles — not the initial spike itself.
Web5 bots automatically pause entries around high-impact news — this protects your capital during chaos.
MODULE 08
Intermarket Analysis
🔴 Advanced
Market Correlations
No market trades in isolation. Gold, the US Dollar, Oil, equities, and crypto are all connected. Understanding these relationships gives you a second layer of confirmation on every trade — and warns you when something doesn't add up.
Pair APair BRelationshipCorrelationTrading Edge
Gold (XAU/USD)USD Index (DXY)Inverse — Gold rises when USD falls−0.85DXY weakness = Gold long bias
EUR/USDUSD Index (DXY)Inverse — EUR rises when USD falls−0.90Strong DXY = EUR/USD short bias
USD/JPYUS 10Y Treasury YieldPositive — higher yields push USD/JPY up+0.78Rising yields = USD/JPY long bias
Oil (WTI/USD)USD/CADInverse — Oil up = CAD stronger vs USD−0.72Oil rally = USD/CAD short setup
Bitcoin (BTC)S&P 500 (SPX)Positive in risk-on markets — move together+0.65SPX sell-off often precedes BTC drop
EUR/USDGBP/USDPositive — both move vs USD together+0.88Divergence between them = signal of strength
AUD/USDGold (XAU/USD)Positive — Australia exports Gold+0.70Gold breakout confirms AUD/USD longs
💵
The US Dollar — Master Currency
The USD is in one side of 88% of all forex trades globally. When the Dollar strengthens, Gold falls, EUR/USD falls, GBP/USD falls, and commodity currencies weaken. When the Dollar weakens, the opposite happens. Always know the DXY (Dollar Index) direction before trading any USD pair.
🏆
Gold as a Risk Indicator
Gold rises during: USD weakness, inflation fears, geopolitical uncertainty, and recession risk. Gold falls during: rising interest rates, strong economic data, and Dollar strength. Watching Gold as a sentiment indicator gives you advance notice of USD moves before they appear in currency pairs.
🛢️
Oil & Commodity Currencies
Rising Oil prices strengthen CAD (Canada exports oil), NOK (Norway), and RUB. They weaken economies that import Oil — like Japan. An Oil breakout is a signal to look for USD/CAD shorts and USD/JPY longs simultaneously. The OilRig bot tracks this correlation in real time.
Crypto & Risk Appetite
Bitcoin and Ethereum correlate positively with equities during risk-on periods — when investors are confident. During risk-off events (crashes, uncertainty), both crypto and stocks sell off together as investors move to cash and bonds. Bitcoin breaking a key level before equities often acts as an early warning signal.
Correlation Confirmation — The Second Opinion Rule
Before entering any trade, check the correlated market for confirmation. If you're buying EUR/USD, check the DXY — is it showing weakness? If you're buying Gold, is EUR/USD also rising? When correlated markets agree, confidence in the trade increases. When they diverge — one moving against the expected correlation — treat it as a warning and reduce position size or skip the trade entirely.
Key Takeaways — Module 08
Always check the DXY before trading any USD pair — it defines the dominant bias for 88% of forex trades.
Gold and USD move inversely — Dollar weakness is a Gold long signal and vice versa.
Oil rising strengthens CAD and weakens JPY — use this for USD/CAD and USD/JPY directional bias.
Bitcoin and S&P 500 correlate positively in risk-on markets — an equity sell-off often precedes a crypto drop.
When correlated markets diverge unexpectedly — reduce size or skip the trade entirely.
MODULE 09
Bot Installation
🟢 Step-by-Step Setup
How to Attach Bots to MT4, MT5, Apex & Tradovate
Full platform-by-platform setup guides. Follow each step exactly and your Web5 bot will be running live on your account. No coding experience required.
💡
Which Platform Should You Use?
MT4/MT5 — best for Forex and Gold. Most brokers support it. Free to use. Apex Trader Funding — funded account program (they give you capital to trade). Uses Rithmic as the data feed. Tradovate — best for US Futures (NQ, ES, CL). Cloud-based, works in browser. All Web5 bots have files for every platform included in your membership.
📊
MetaTrader 4 (MT4)
Forex · Gold · CFDs — Expert Advisors (.ex4 files)
Most Popular
01
Download & Install MT4
Go to your broker's website and download MetaTrader 4. Popular brokers: IC Markets, Pepperstone, OANDA, XM. Install MT4 and log in with your account credentials. Demo accounts are free — start there.
File: MT4Setup.exe → Install → Login
02
Open the Data Folder
In MT4: click File → Open Data Folder. A Windows Explorer window opens. Navigate to: MQL4 → Experts. This is where your bot files go.
File → Open Data Folder → MQL4 → Experts
03
Copy Your Web5 Bot File
From your Web5 member download, copy the .ex4 file for your chosen bot (e.g. GoldStrike_EA.ex4). Paste it into the Experts folder you just opened. Close the folder.
Copy .ex4 file → Paste into Experts folder
04
Refresh MT4 Navigator
Back in MT4: right-click Expert Advisors in the Navigator panel (left side) → click Refresh. Your Web5 bot will appear in the list under Expert Advisors.
Navigator → Expert Advisors → Right-click → Refresh
05
Attach Bot to Chart
Open the chart for the market your bot trades (e.g. XAUUSD for GoldStrike). Drag and drop the bot from the Navigator onto the chart. A settings window opens — configure your lot size and risk settings. Click OK.
Drag Bot → Drop on Chart → Configure Settings → OK
06
Enable AutoTrading
Click the AutoTrading button in the MT4 toolbar (top). It turns green when active. A smiley face appears in the top-right corner of your chart. Your bot is now live — it will place trades automatically 24/5.
Toolbar → AutoTrading Button → Green = Active ✓
⚠ MT4 Must Stay Open
MT4 must be running continuously for the bot to trade. Use a VPS (Virtual Private Server) to keep it running 24/7 without leaving your computer on. Many brokers offer free VPS for active accounts. Alternatively, use MetaAPI (#104 in the Web5 workforce) to run bots in the cloud without a VPS.
📈
MetaTrader 5 (MT5)
Forex · Stocks · Futures · Crypto — Expert Advisors (.ex5 files)
Upgraded Version
01
Install MT5 & Open Data Folder
Download MT5 from your broker or MetaQuotes. Install and log in. Click File → Open Data Folder. Navigate to: MQL5 → Experts. Same process as MT4 but the folder is MQL5 instead of MQL4.
File → Open Data Folder → MQL5 → Experts
02
Copy Your .ex5 Bot File
Copy the .ex5 file from your Web5 member download into the Experts folder. MT5 uses .ex5 format — do not use .ex4 files in MT5.
Copy .ex5 file → Paste into MQL5/Experts
03
Compile in MetaEditor (if source file)
If your file ends in .mq5 (source code) instead of .ex5: open it in MetaEditor (press F4 in MT5) → click Compile (F7). This creates the .ex5 file automatically. Then refresh the Navigator.
F4 → MetaEditor → Open .mq5 → F7 Compile
04
Attach to Chart & Enable Algo Trading
Refresh Navigator → drag bot onto chart → configure settings → OK. Then click Algo Trading button in the toolbar (MT5 calls it "Algo Trading" instead of "AutoTrading"). Green = running. Check the Experts tab at the bottom for log messages confirming the bot is active.
Algo Trading Button → Green → Check Experts Log Tab
🏆
Apex Trader Funding
Funded Futures Accounts — Rithmic Data Feed — NQ, ES, CL, Gold
Funded Capital
💡
What is Apex Trader Funding?
Apex gives you a funded account — they provide the capital ($25K–$300K) and you trade it. If you're profitable, you keep up to 90% of profits. You pass an evaluation first (called a "combine") which tests your discipline. Web5 bots are designed to pass Apex evaluations — consistent, rule-based, within drawdown limits.
01
Create Your Apex Account & Choose a Plan
Go to apextraderfunding.com → sign up → choose your evaluation account size ($25K, $50K, $100K, $150K, $250K, or $300K). The evaluation fee ranges from ~$47–$657. Start with $50K — the most popular balance for bots.
apextraderfunding.com → Sign Up → Select Plan
02
Download Rithmic & NinjaTrader / Tradovate
Apex uses Rithmic as its data/execution infrastructure. You connect Rithmic to a compatible front-end: NinjaTrader 8 (recommended for bots), Tradovate, or R Trader Pro. Download NinjaTrader 8 from ninjatrader.com — free to download.
Download NinjaTrader 8 → Free at ninjatrader.com
03
Connect Rithmic to NinjaTrader
In NinjaTrader: Tools → Connections → Configure. Click Add → select Rithmic. Enter your Apex credentials (same username/password from your Apex account). Select server: Apex Trader Funding. Click OK → Connect. Wait for green connection indicator.
Tools → Connections → Add → Rithmic → Apex Credentials
04
Install the Web5 NinjaTrader Strategy
From your Web5 download: locate the .zip NinjaTrader strategy file. In NinjaTrader: Tools → Import → NinjaScript Add-On. Select the .zip file → Import. The strategy installs and appears in your strategy list under NinjaScript Strategies.
Tools → Import → NinjaScript Add-On → Select .zip
05
Apply Strategy to Chart
Open a chart for your futures market (e.g. NQ, ES, CL). Right-click the chart → Strategies → Add Strategy. Select your Web5 strategy from the list. Configure: account (your Apex eval account), quantity (1 contract to start), and confirm the strategy parameters match Apex rules. Click OK → Enable.
Right-click Chart → Strategies → Add → Configure → Enable
06
Verify Apex Rules Are Met
Apex has strict rules your bot must follow: Daily Loss Limit (never exceed daily drawdown), Trailing Drawdown (max account drawdown), Profit Target (reach minimum profit to pass). All Web5 Apex bots are pre-configured to operate within these parameters. Verify in your Apex dashboard daily.
Check Apex Dashboard Daily · Drawdown · Profit Target
Apex Rule$50K Account$100K AccountBot Setting
Daily Loss Limit$1,500$2,500Set bot daily stop = 80% of limit
Max Trailing Drawdown$2,500$3,000Keep max drawdown < 4%
Profit Target (Combine)$3,000$6,000Bot targets ~1.5–2% per week
Minimum Trading Days7 days7 daysBot trades Mon–Fri automatically
Contracts Allowed10 max14 maxStart with 1–2 contracts
Tradovate
US Futures — Cloud-Based — NQ, ES, CL, GC — Works in Browser
Cloud Platform
💡
Tradovate Bot Automation — How It Works
Tradovate does not run scripts directly. Instead, bots connect to Tradovate via its API — a connection that lets your bot send orders automatically. Web5 provides ready-to-use automation scripts that connect to Tradovate using their official API. You install the script on your computer and it places trades inside your Tradovate account automatically.
01
Create Tradovate Account
Go to tradovate.com → sign up for a free simulated account (paper trading) to test first. For live trading, fund your account via ACH or wire transfer. Tradovate has a flat monthly fee (no per-trade commissions) — $99/month for live accounts.
tradovate.com → Sign Up → Fund Account
02
Enable API Access
In Tradovate: go to Account Settings → API Access. Generate your API credentials (username and API key). These credentials allow your Web5 bot script to log into Tradovate and place orders on your behalf. Keep these credentials private — treat them like your account password.
Account Settings → API Access → Generate Credentials
03
Configure the Web5 Tradovate Script
From your Web5 download, open the Tradovate bot config file (config.json). Enter your API credentials, choose your account type (demo or live), select the futures contract to trade (e.g. NQM4 for Nasdaq Mini), and set your position size (1 contract minimum). Save the file.
Open config.json → Enter API Key → Set Contract & Size
04
Run the Bot Script
Open PowerShell or Terminal. Navigate to the Web5 bot folder. Run: node bot.js (or the launcher script provided). The bot will connect to Tradovate, confirm the connection in the terminal output, and begin scanning for setups. Keep this terminal window open while trading.
Start Command
cd C:\Web5Bots\Tradovate
node bot.js
# Terminal will show: ✓ Connected to Tradovate
05
Monitor in Tradovate Dashboard
Log into trader.tradovate.com in your browser. Go to Positions and Orders tabs to see the bot's activity in real time. You can override or close any position manually at any time — the bot does not block manual control. Review Account Performance daily.
trader.tradovate.com → Positions → Orders → Monitor
Platform Compatibility — Web5 Bots
BotMT4MT5Apex/RithmicTradovateTradingView
GoldStrike EA (XAU/USD)✓ GC✓ GC✓ Pine
EuroPulse EA (EUR/USD)✓ Pine
NasdaqNinja EA (NQ)✓ NQ✓ NQ✓ Pine
SPX500 EA (S&P 500)✓ ES✓ ES✓ Pine
OilRig EA (WTI Crude)✓ CL✓ CL✓ Pine
BitBeast EA (BTC/USD)✓ Pine
All Forex Bots✓ Pine
Key Takeaways — Module 09
MT4/MT5: copy .ex4/.ex5 file to Experts folder → refresh → drag onto chart → enable AutoTrading.
Apex Trader Funding: connect Rithmic to NinjaTrader → install Web5 strategy → verify Apex rules daily.
Tradovate: enable API access → configure config.json with credentials → run node bot.js → monitor dashboard.
Always test on demo/sim account for minimum 2 weeks before switching to live capital.
MT4/MT5 must stay running — use a VPS or MetaAPI (#104) for 24/5 cloud execution.
REFERENCE
Beginner Glossary
🟢 Start Here
Trading Terms Explained Simply
Every term you need to know — in plain English, no jargon. Bookmark this and refer back to it whenever you see an unfamiliar word.
Pip
The smallest price move in forex. For EUR/USD: 0.0001. If EUR/USD moves from 1.1000 to 1.1010, that's 10 pips.
Spread
The difference between the buy price and sell price. The broker's fee. Tighter spread = cheaper to trade.
Lot Size
How much of a currency you're trading. 1 Standard Lot = 100,000 units. Mini Lot = 10,000. Micro Lot = 1,000.
Leverage
Borrowing power from your broker. 100:1 leverage means $1,000 controls $100,000. Amplifies gains AND losses.
Stop Loss
A pre-set order to automatically close your trade if price moves against you by a certain amount. Protects your capital.
Take Profit
A pre-set order to automatically close your trade when price reaches your target. Locks in your gain without you watching.
Long / Buy
You expect price to go UP. You buy at a lower price and sell at a higher price to profit.
Short / Sell
You expect price to go DOWN. You sell at a higher price and buy back at a lower price to profit.
Support
A price level where buyers have historically stepped in to stop the price from falling further. A "floor."
Resistance
A price level where sellers have historically pushed price back down. A "ceiling" that price struggles to break through.
ATR
Average True Range — measures how much a market moves on average per candle. Used to size stop losses scientifically.
EMA
Exponential Moving Average — a line on the chart showing the average price over a set number of candles. Used to identify trend direction.
Risk:Reward (R:R)
The ratio of potential loss vs potential gain. 1:2 R:R means risking $100 to make $200. Always aim for 1:2 or better.
Drawdown
The peak-to-trough decline in your account. 20% drawdown from $10,000 means your account dropped to $8,000 at its lowest point.
Confluence
When multiple signals or levels agree on the same direction. A pin bar + at support + during London open = high confluence setup.
Backtest
Running a trading strategy on historical data to see how it would have performed in the past before risking real money.

Knowledge Applied.
Now Deploy the Bots.

You've covered the complete framework — structure, execution, targets, and validation. The Web5 bots are pre-built, backtested, and ready for your account.